LINK TO ALL RESPECTIVE DIAGRAM- https://drive.google.com/open?id=1Jk-BimBQinbV0xbxFcr-cTrK_41dcf6h
Data Flow Diagram
Data flow diagram is graphical representation of flow of data in an information system. It is capable
of depicting incoming data flow, outgoing data flow and stored data. The DFD does not mention
anything about how data flows through the system.
There is a prominent difference between DFD and Flowchart. The flowchart depicts flow of control
in program modules. DFDs depict flow of data in the system at various levels. DFD does not contain
any control or branch elements.
Types of DFD
Data Flow Diagrams are either Logical or Physical.
Logical DFD – This type of DFD concentrates on the system process, and flow of data in the
system.For example in a Banking software system, how data is moved between different
entities.
Physical DFD – This type of DFD shows how the data flow is actually implemented in the
system. It is more specific and close to the implementation.
DFD Components
DFD can represent Source, destination, storage and flow of data using the following set of
components –
Entities – Entities are source and destination of information data. Entities are represented by a
rectangles with their respective names.
Process – Activities and action taken on the data are represented by Circle or Round-edged
rectangles.
Data Storage – There are two variants of data storage – it can either be represented as a
rectangle with absence of both smaller sides or as an open-sided rectangle with only one side
missing.
Data Flow – Movement of data is shown by pointed arrows. Data movement is shown from
the base of arrow as its source towards head of the arrow as destination.
Levels of DFD
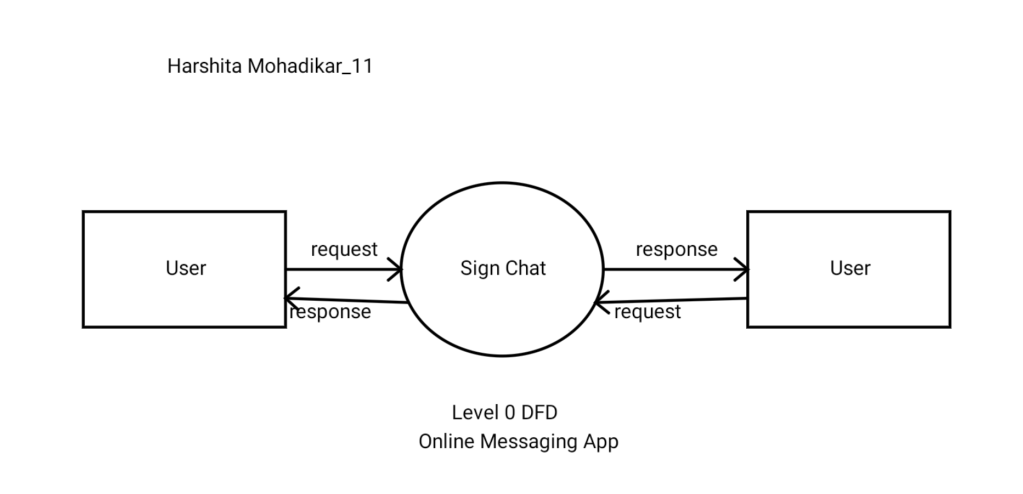
Level 0 – Highest abstraction level DFD is known as Level 0 DFD, which depicts the entire
information system as one diagram concealing all the underlying details. Level 0 DFDs are
also known as context level DFDs.
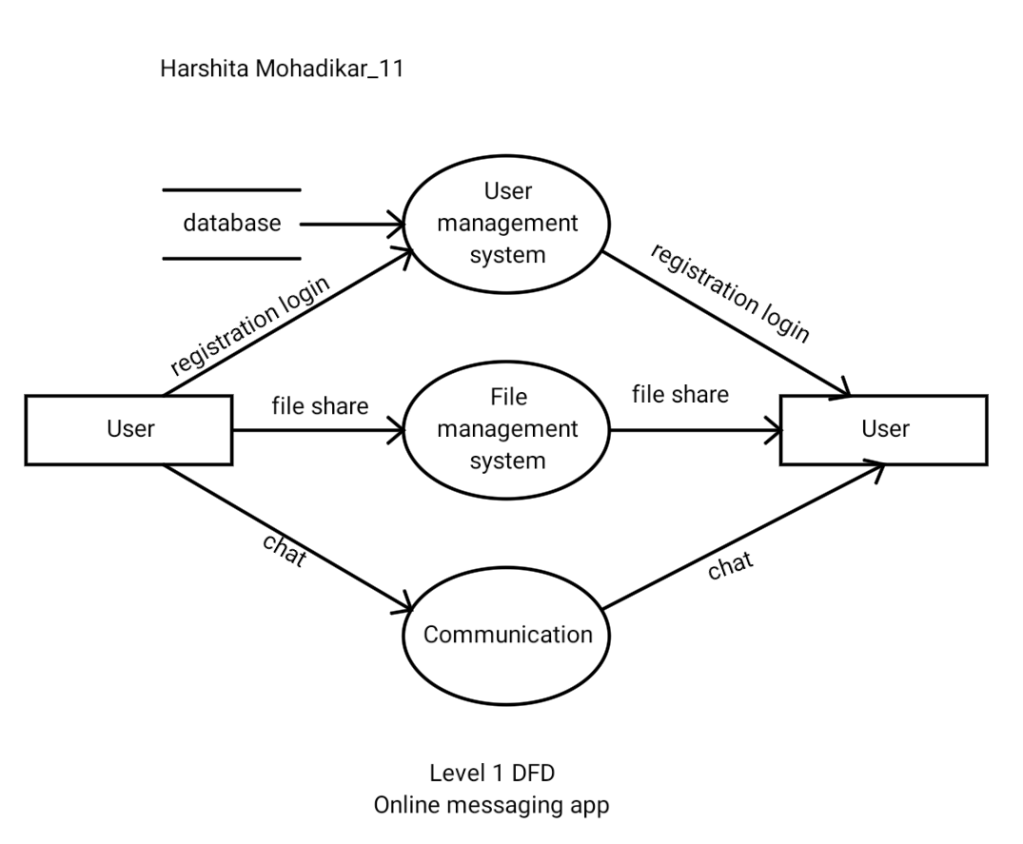
Level 1 – The Level 0 DFD is broken down into more specific, Level 1 DFD. Level 1 DFD
depicts basic modules in the system and flow of data among various modules. Level 1 DFD
also mentions basic processes and sources of information.
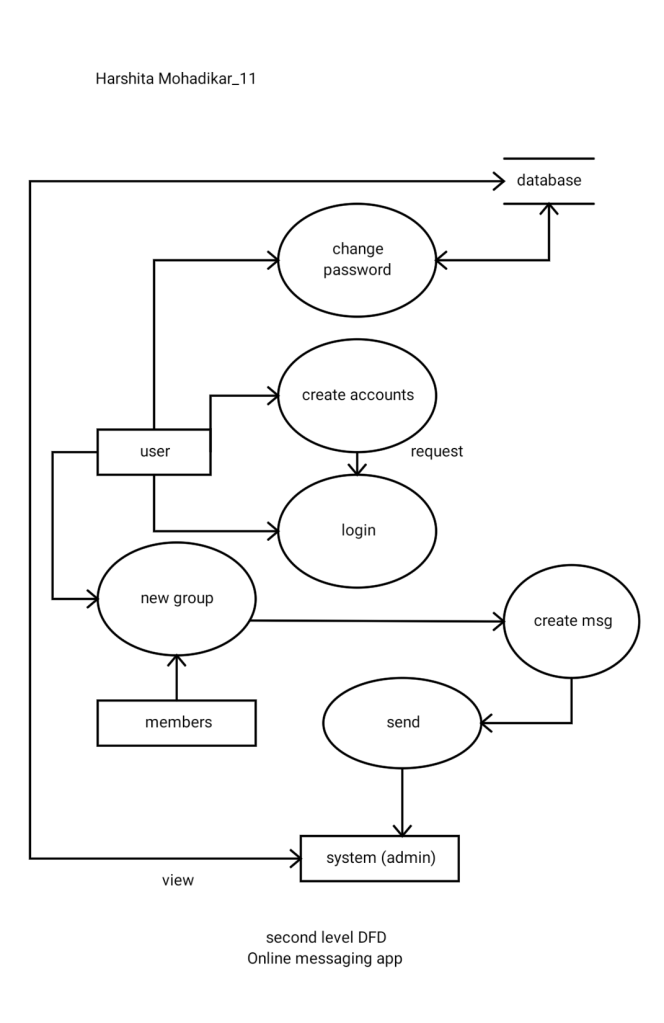
Level 2 – At this level, DFD shows how data flows inside the modules mentioned in Level 1.
Higher level DFDs can be transformed into more specific lower level DFDs with deeper level
of understanding unless the desired level of specification is achieved
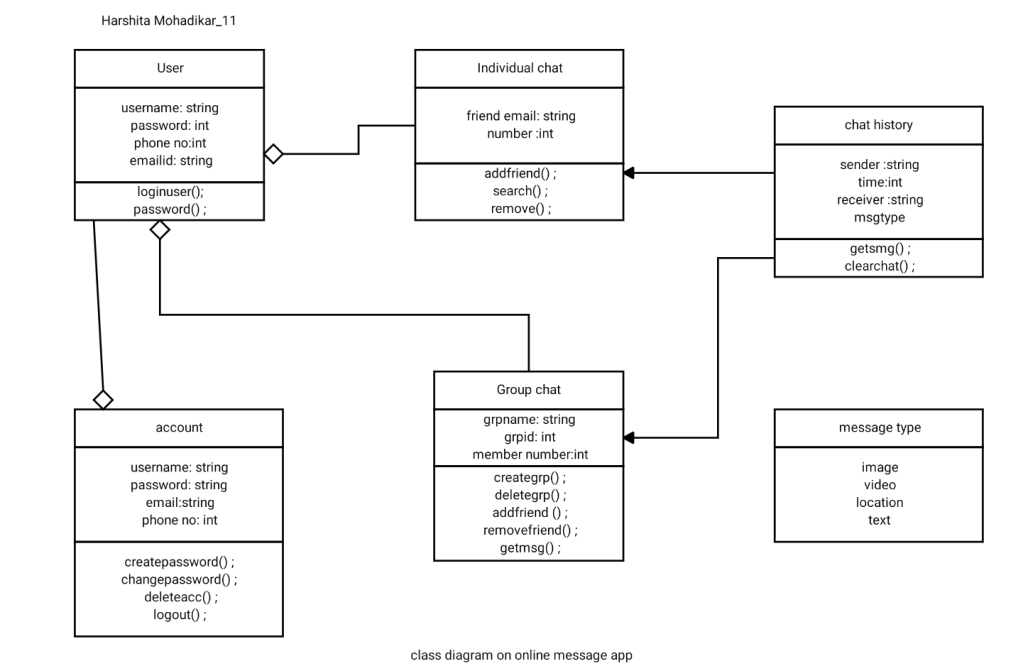
1.Class diagram
The class diagram is a static diagram. It represents the static view of an application. Class diagram is
not only used for visualizing, describing and documenting different aspects of a system but also for
constructing executable code of the software application. The class diagram describes the attributes
and operations of a class and also the constraints imposed on the system.
So the purpose of the class diagram can be summarized as:
- Analysis and design of the static view of an application.
- Describe responsibilities of a system.
- Base for component and deployment diagrams.
- Forward and reverse engineering.
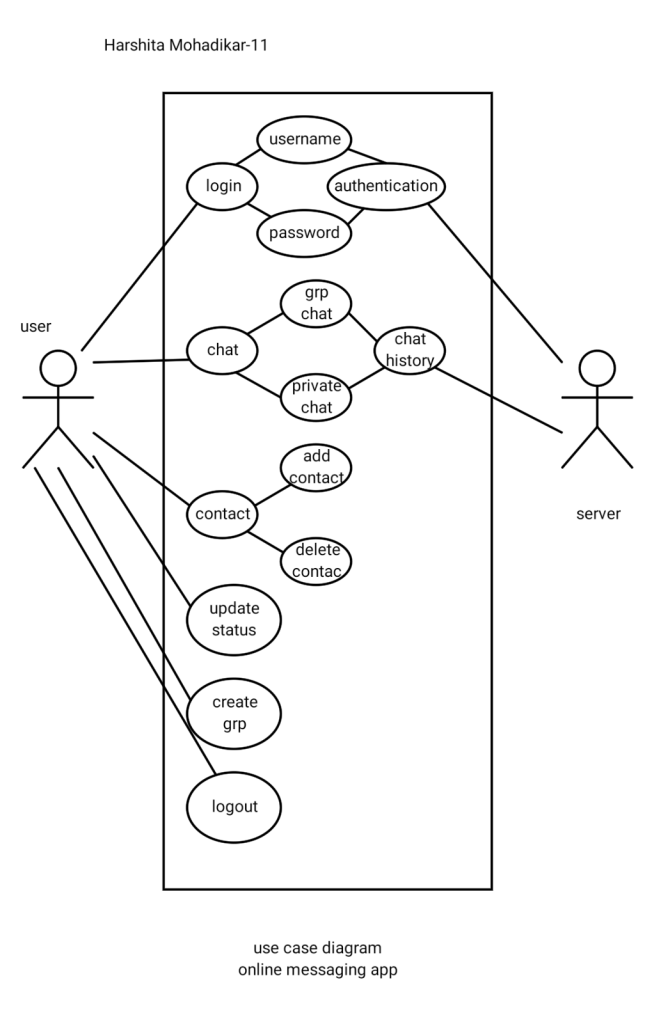
2.Use case diagram
A Use case Diagram is a diagram that shows a set of Use cases and actors and their relationships.
These diagrams are used to model the static use case view of a system.
The diagram is used to model the system/subsystem ofan application. A single use case diagram
captures a particular functionality of a system. So to model the entire system numbers of use case
diagrams are used.
So in brief, the purposes of use case diagrams can be as follows:
Used to gather requirements of a system.
Used to get an outside view of a system.
Identify external and internal factors influencing the system.
Show the interacting among the requirements are actors.
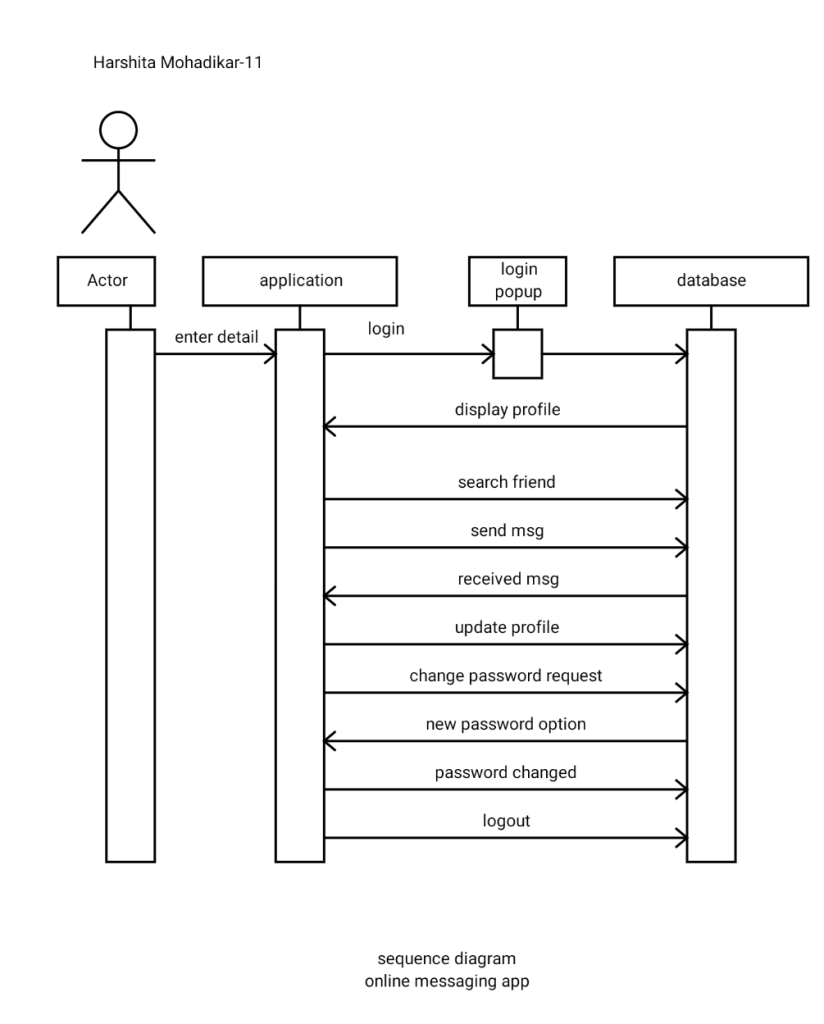
Sequence Diagram:
A Sequence diagram is an interaction diagram that shows how processes operate with one another
and in what order. It is a construct of a message sequence chart. A sequence diagram shows object
interactions arranged in time sequence. It depicts the objects and classes involved in the scenario and
the sequence of messages exchanged between the objects needed to carry out the functionality of the
scenario. Sequence diagrams are sometimes called event diagrams or event scenarios.
A sequence diagram shows, as parallel vertical lines (lifelines), different processes or objects that live
simultaneously, and, as horizontal arrows, the messages exchanged between them, in the order in
which they occur. This allows the specification of simple runtime scenarios in a graphical manner.
Notations :
- Actor: Definition An Actor models a type of role played by an entity that interacts with the
subject (e.g., by exchanging signals and data), but which is external to the subject (i.e., in the sense
that an instance of an actor is not a part of the instance of its corresponding subject). Actors may
represent roles played by human users, external hardware, or other subjects.
- Call Message :Definition A message defines a particular communication between
Lifelines of an Interaction.
Call message is a kind of message that represents an invocation of operation of target lifeline.
3.Lifeline:Definition A lifeline represents an individual participant
in the Interaction.
- Return Message: Definition
A message defines a particular communication between Lifelines of an Interaction.
Return message is a kind of message that represents the pass of information back to the caller of a
corresponded former message. - Destroy Message :Definition A message defines a
particular communication between Lifelines of an Interaction.
Destroy message is a kind of message that represents the request of destroying the lifecycle of target
lifeline.
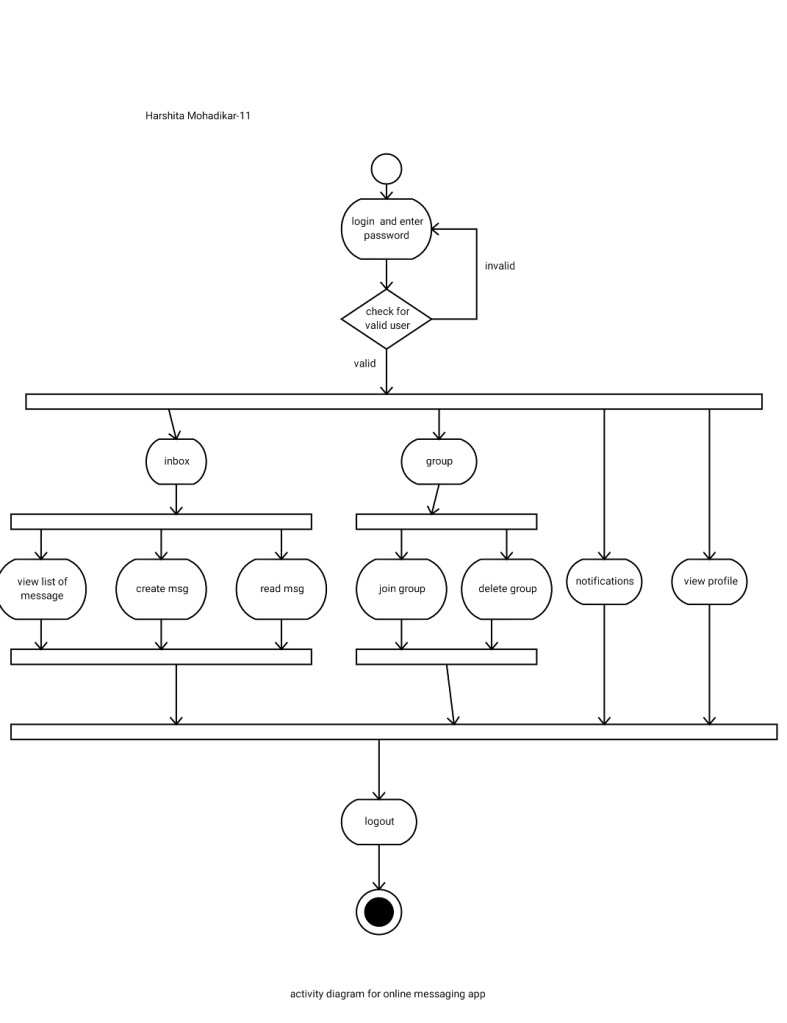
Activity Diagram
An activity diagram visually presents a series of actions or flow of control in a system similar to a
flowchart or a data flow diagram . Activity diagrams are often used in business process modeling.
They can also describe the steps in a use case diagram . Activities modeled can be sequential and
concurrent. In both cases an activity diagram will have a beginning and an end.
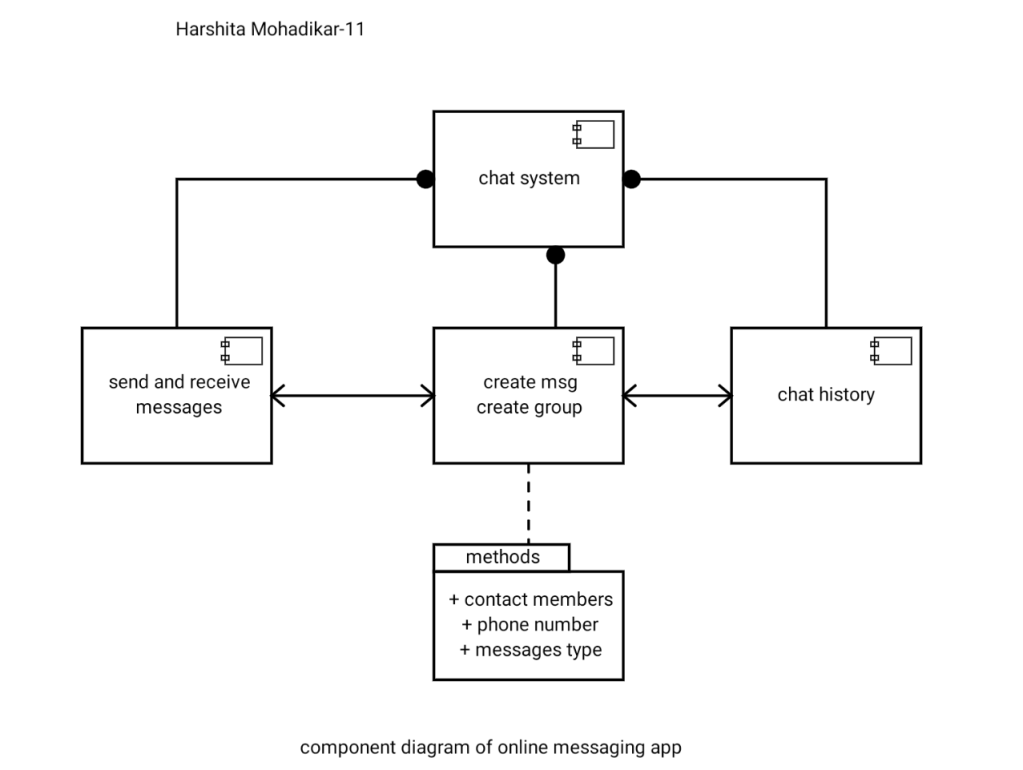
2)Component Diagram:
Component diagrams are different in terms of nature and behaviour. Component diagrams are used to
model physical aspects of a system.
Physical aspects are the elements like executables, libraries, files, documents etc which resides in a
node.So component diagrams are used to visualize the organization and relationships among
components in a system. These diagrams are also used to make executable systems
Notation:
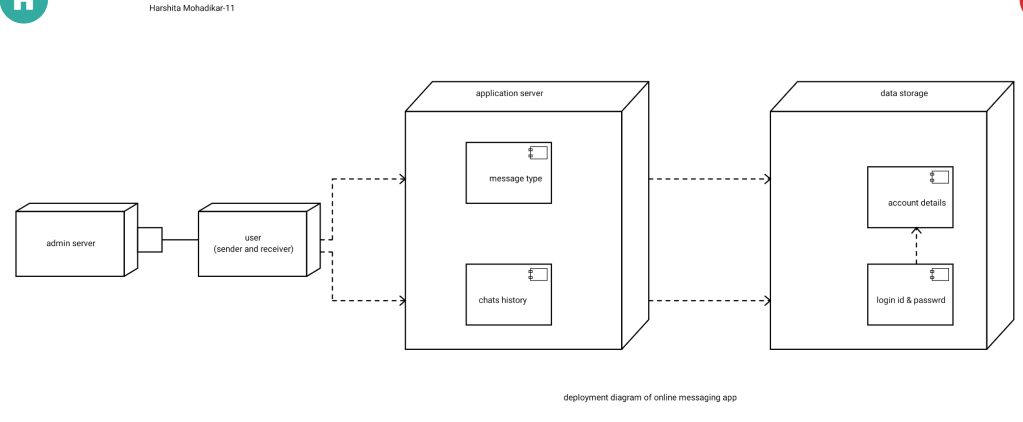
3) Deployment
Diagram:
Deployment diagrams are used to visualize the topology of the physical components of a system
where the software components are deployed.
So deployment diagrams are used to describe the static deployment view of a system. Deployment
diagrams consist of nodes and their relationships.